Why Sponsor Oils? | blog | oilshell.org
The last post, Garbage Collector Problems, was a status update on Oil's C++ runtime, about 4 months in.
Since then, we solved both the "rooting" and fork()-friendly problems. So this post shows a demo of a fast shell in C++, with a working garbage collector! Remember, the oil-native tarball contains no Python code at all, and now it uses less memory.
More in this post:
This topic can be dense and wordy, so I break it up with screenshots of the many tools we used: ASAN, GDB, perf and flame graphs, R for benchmarking, and more. I want to give contributors a sense of what working on Oil is like.
We can still use more help! Good news: we now have a second grant with NLnet. Let me know if working on this sounds fun. Follow our new account @oilsforunix on Mastodon.
Big thanks to Jesse Hughes, Melvin Walls, and CoffeeTableEspresso for essential help on the C++ runtime. Thanks again to NLnet for funding us.
If you click on this screenshot, you'll see OSH running ./configure from CPython's tarball, with GC debug output.
This is:
_OIL_GC_VERBOSE=1 logging.It was a thrill to get this working! Remember that the interpreter took years to write.
Here's another way to look at it. We now run benchmarks on every commit, including memory measurements with getrusage().
In November, our "leaky" prototype used ~550 MB of memory running Python's ./configure, which is 20x more than bash!

When we turned on the garbage collector, the memory usage was reduced by 10x.

Note that this is one of our hardest workloads. On 3 other hand-written ./configure scripts, OSH already matches the speed and memory usage of bash. Most shell scripts are I/O bound.
We've also made progress since then: as of the latest CI run, the autoconf-generated script uses 1.6x more memory under OSH, not 2.0x. It's now 1.4x slower, not 1.9x slower. After we fix a few "dumb things", it should be just as fast.
How did we get it working? What were the wrong turns? This section summarizes a part of this long journey.
In the last post, I mentioned that we might change our rooting policy. The rooting problem is: Where does the collector start tracing?
A major motivation was "the f(g(), h()) problem", which we found with ASAN. (I just noticed that LLVM's docs call out precisely this problem, naming it h(f(), g())! )
I proposed a policy called "Return Value Rooting", ran it by a few people, and mentioned it on the blog.
Some contributors were convinced by the logic, so I went ahead and implemented it, testing it on the same mycpp examples. It fixed 5 failures, but our recursive descent parsing test case parse.py failed in a new way.
Parsing 1+2 =>
=================================================================
==15704==ERROR: AddressSanitizer: heap-use-after-free on address 0x6020000023f0 at pc 0x55b1eeba4d01 bp 0x7ffde9fe6e90 sp 0x7ffde9fe6e80
READ of size 1 at 0x6020000023f0 thread T0
    #0 0x55b1eeba4d00 in ObjHeader(Obj*) /home/andy/git/oilshell/oil/mycpp/gc_obj.h:114
    #1 0x55b1eeba5f31 in MarkSweepHeap::MarkObjects(Obj*) mycpp/mark_sweep_heap.cc:125
    #2 0x55b1eeba6099 in MarkSweepHeap::MarkObjects(Obj*) mycpp/mark_sweep_heap.cc:136
    #3 0x55b1eeba54f3 in RootSet::MarkRoots(MarkSweepHeap*) mycpp/mark_sweep_heap.cc:11
    #4 0x55b1eeba687a in MarkSweepHeap::Collect() mycpp/mark_sweep_heap.cc:202
I realized that the problem is fundamental: it doesn't handle mutating member variables correctly!
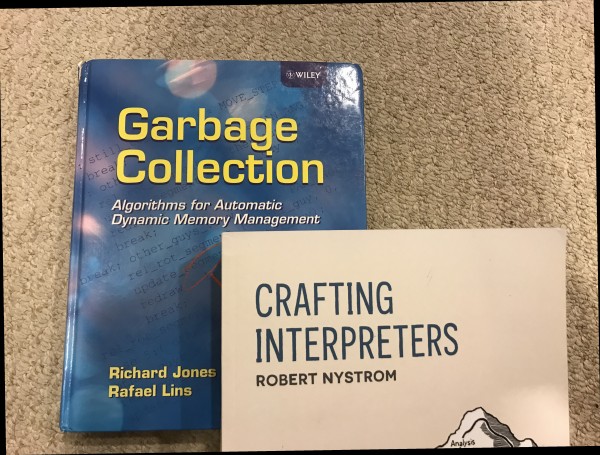
I was discouraged. This garbage collector seemed to have more failed attempts than any program I've ever written! I went back to the drawing board, reviewing my large collection of links, notes, and books.
My first thought was to pursue the simplest possible conservative/imprecise stack scanner, just to get something working (on one architecture). It would temporarily "unblock" the project.
I had conjectured with contributors that Boehm GC was essentially a way of saying "screw it" to the rooting problem in C++, and thus to precise garbage collection. That is, it's a hack that language implementers came up with ~30 years ago to work around exactly the problems we were having.
Here's one thread of notes: #oil-dev > Conservative GC Design Links.
It includes a long 2015 conversation on an option for conservative GC in Julia, which basically scared me off again. There is a fair amount of controversy about conservative collection. (It now appears to be a workaround for integrating with unusual libraries, not Julia's main approach.)
To make a long story short, I went back to an even simpler solution, which I call:
We simply insert mylib.MaybeCollect() manually in the interpreter's Python source. It gets preserved as mylib::MaybeCollect() in C++.
You could call these ad hoc GC safe points. A safe point answers the question: When does the GC have enough information to collect?
I noted that the term "safe point" doesn't appear in index of the Garbage Collection Handbook. It's not an algorithm issue, but an implementation issue which is nonetheless difficult.
What's surprising is that we only need a handful of manual collection points in our 40K-line interpreter — primarily the Python loop that interprets shell for and while loops! If you think about it, loops are the primary ways for programs to create unbounded garbage.
(It's possible for a single MaybeCollect() call to run after every shell statement, not just loops. Max Bernstein pointed out that recursion in shell is possible, so we'll probably do this.)
Either way, this solution has a number of nice properties:
(1) It drastically reduces the state space explosion that collecting at every allocation creates.
The old policy turned every allocation into a branch — collect, or don't collect — which needs test coverage.
(2) It avoids the f(g(), h()) problem, and more problems like #oil-dev> Allocating in a constructor, which CoffeeTableEspresso ran into.
// Bug: if Foo::Foo() allocates a member variable, the instance
// may be swept away before it's bound to myobj and thus rooted

myobj = Alloc<Foo>();
More problems: #oil-dev > Interactions Between C++ and GC
(3) It let us delete all rooting annotations from hand-written code!
To tell the GC where to start tracing, mycpp generates a line like this for every function:
StackRoots _r({ &local1, &local2, ... });
But we also have ~7,000 lines of hand-written code, which means that hundreds of functions had such manual annotations.
With the new manual collection points, we can throw them all out!
This is because hand-written functions like Str::strip() and posix::fork() can never be lower on the stack than a manual collection point. In the old scheme, Str::strip() could call a function that may collect.
So they're a now bit like "leaf nodes" of the call tree.
This slightly unexpected property makes it easier to work on Oil. We try to write the simplest code possible.
Our runtime is instrumented with OIL_GC_STATS=1, and we collect data on real shell programs in our CI. If anything, we're still checking for collection too often, not too rarely.
So I don't see any real downsides!
While in theory the shell may use more memory than necessary in some cases, typical workloads consist of many tiny objects. And there are many other ways we should optimize memory usage, mentioned below.
So I think I misconceptualized our bugs as a rooting issue — being fastidious about where to start tracing — but it's more useful to think about when to collect.
(An appendix has another framing of this design problem. It was essentially impossible without changes to the C++ language, which have been proposed on and off for ~30 years.)
In the Reddit comments on my last post, two readers pointed out very relevant research. (Thank you! This is why I write these posts.)
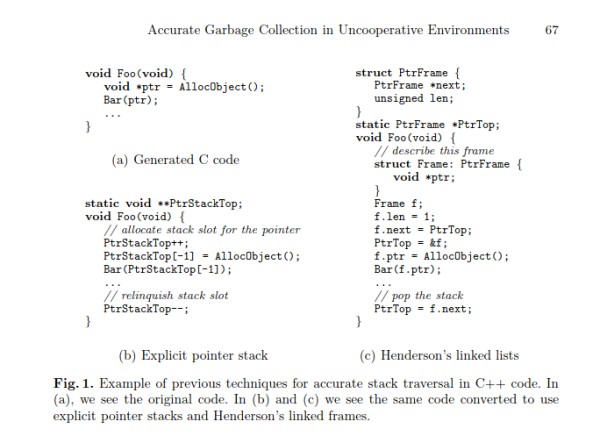
I wrote Zulip notes on these papers, as well as on Boehm GC, but here I'll just say that reading them made me feel better.
So after switching to manual GC points, all of our tests passed under ASAN and #ifdef GC_ALWAYS. This feels good after months of latent segfaults, but it isn't too surprising, since there are many fewer code paths.
Does the shell run? No, there were still quite a few crashes.
I'll recap that thread after giving some color on GC bugs in general, and our problem specifically.
From a former v8 lead, and WebAssembly co-author:
I utterly hate debugging garbage collection bugs. Besides stress mode, fuzzing, and tracing output, there isn't really much to help you. A good debugger is a must. But even then, I feel like it is a special kind of hell.
— Ben L. Titzer (@TitzerBL) August 30, 2022
I definitely had this experience with the moving Cheney collector. It had the additional complication of being at the metalanguage level, where it interacts with dozens of C++ features.
The C++ translation essentially stalled because it was too difficult to debug!
Hans Boehm motivates conservative garbage collection:
It is difficult to design a compiler such that the generated code is guaranteed to preserve garbage collection invariants. [Errors] in the object code can potentially go unnoticed for long periods of time. Even when they do appear, the problem is difficult to isolate, since symptoms usually appear a long time after the erroneous code was executed.
Garbage collection bugs tend to be among the last to be removed from a new programming language implementation.
— Garbage Collection in an Uncooperative Environment (Boehm, 1988)
So how did we find and fix our GC bugs? Are there more lurking?
Again, the most useful technique is to use ASAN as much as possible. It's built into both Clang and GCC, and trivial to use (pass -fsanitize=address). It compiles your program with runtime instrumentation of allocations.
It's mainly used to find classic C and C++ errors with manual memory management, but it works just as well for a garbage collector that uses malloc() and free(). (We'll have a custom allocator for performance, but will always retain this option!)
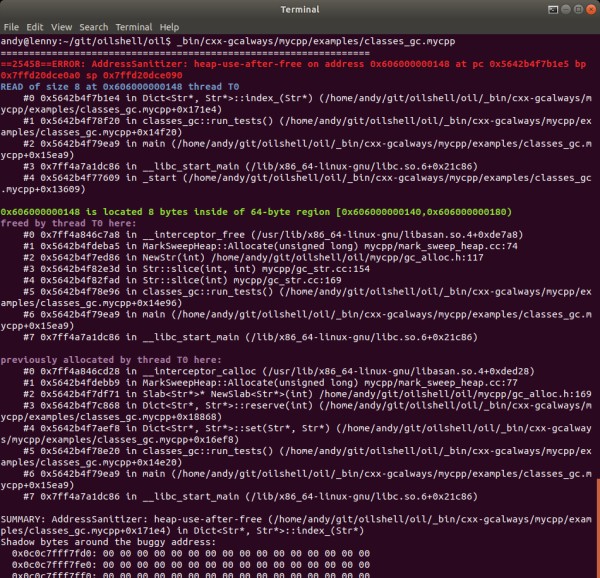
There were two common failure modes:
(A) Heap Use After Free. A common sequence of events:
free() on it.(B) Seg Faults, e.g. due to missing object headers. ASAN basically gives you a stack trace, so in many cases you don't have to bother starting the debugger.
Even though ASAN reliably turns use-after-free into crashes, and these bugs ultimately had simple causes, they were not trivial to diagnose. The core problem is that by the time the crash happens, the debugger lacks type information.

I want to re-emphasize this "reality sandwich" view of garbage collection, described in May:
Dict, List, Str, etc.ObjHeader*, with children traced by HeapTag::FixedSize and HeapTag::Scanned.The middle layer is carefully designed to be compatible with the top and bottom views. Precise garbage collection requires this.
While you usually debug your program thinking about the top layer, the crashes happen in the bottom layer.
Here are more debugging techniques I used:
Validate the roots as soon they're registered, not just on collection. Assert everything you can about the object headers, e.g. that they have valid tags like HeapTag::FixedSize.
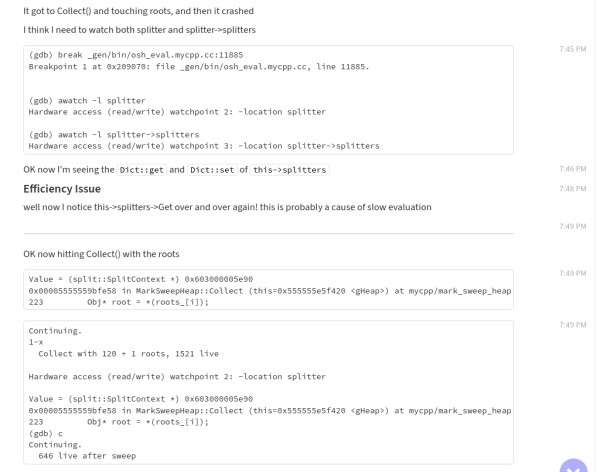
GDB watch points using the command awatch -l myvar.
This is useful because ASAN gives you 3 stack traces:
Sweep() phase of collector: the bottom layer.So by putting a watchpoint on a memory location, you can see where an object is touched by both "bread" layers.
Now that we understand the debugging task, here's a summary of that Zulip thread: #oil-dev > Summary of GC Bugs
Logic errors generating GC metadata:
constexpr field masks overflowed 16 bits! In other words, a few classes had more than 16 members.
Tag::Scanned instead of Tag::FixedSize.Tag::Scanned objects in mycpp. This was due to a legacy of the Cheney collector, which has now been cleaned up.Tag::Opaque optimization.Missing GC metadata:
frontend/flag_gen.py code generator.core/optview_gen.py code generator.
ParserSpec class.Missing global roots:
stdout and stderr.(These are the only 3 globals in Oil!)
getline() binding, which ASAN flagged.
libc, which means ASAN's stack trace was confusing.So none of the bugs were in the collector itself; they were issues with the metadata used for rooting and tracing.
So I now envision a garbage collector as an octopus!

If there's a single mistake in the logic of the second part, the octopus's brain explodes.
So this was the cause of essentially all 9 bugs. Precise garbage collection requires precise metadata, all over the program.
After this experience, I'm now confident our collector will be reliable. Why?
An unexpected benefit of writing the shell in Python is that the vast majority of GC metadata is in generated source code. We don't have dozens or hundreds of bugs like Mozilla explained in Clawing Our Way Back to Precision (2013).
So our source code isn't littered with any of:
Py_INCREF and Py_DECREFSo I expect that the C++ runtime will change slowly, and new features to the shell will be added in Python, where it's impossible to make mistakes with memory.
This great PyPy retrospective makes a similar point:
RPython is a garbage collected language, and the interpreter does not have to care much about GC in most cases. When the C source code is generated, a GC is automatically inserted. This is a source of great flexibility. Over time we experimented with a number of different GC approaches, from reference counting to Boehm to our current incremental generational collector
In fact, I revived the Cheney collector, as an experiment in performance. It may work well with our new manual GC points.
I have a lot to say about performance, including describing 3 immediate fixes:
free()" algorithm tweak fell out of recycling object IDs, and improved performance.And future plans:
ObjHeader before any vtable pointerThis work is guided by many benchmarks:
This post is already long, so I won't go into detail. Each piece of work above has a thread on Zulip.
Follow our new Mastodon account or Twitter account if you want to learn more.
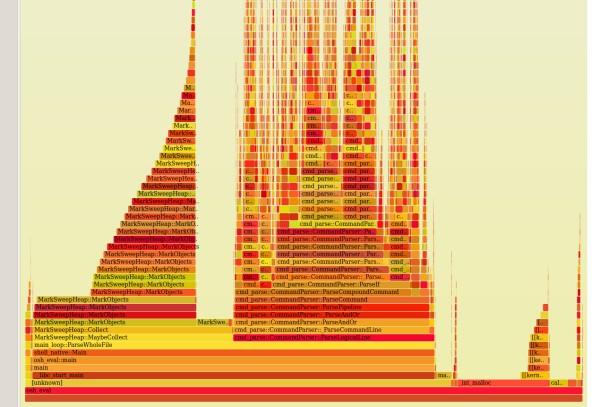

Writing this collector was a lot of work, but we ended up with something that's simple and reliable.
It's now clear that the OSH part of the project will "exist". We still have some work to do to replace the Python tarball with the oil-native tarball, but it will happen.
But the Oil language has stalled for nearly 6 months. I've gotten great feedback from people like Samuel Hierholzer and James Sully, which I hope to address soon.
I've also been falling behind on shell advocacy (#shell-the-good-parts). For now, I'll point out that shell was the sixth fastest growing language on Github in 2022. We still need a new shell.
And the #1 fastest growing language is the Hashicorp Config Language. A new component of Oil is very similar to it — interleaved with a principled shell, and decoupled from any application:
To get these efforts going again, I'll try to get more people involved with the project. Let me know if you want to be paid to work on open source code!
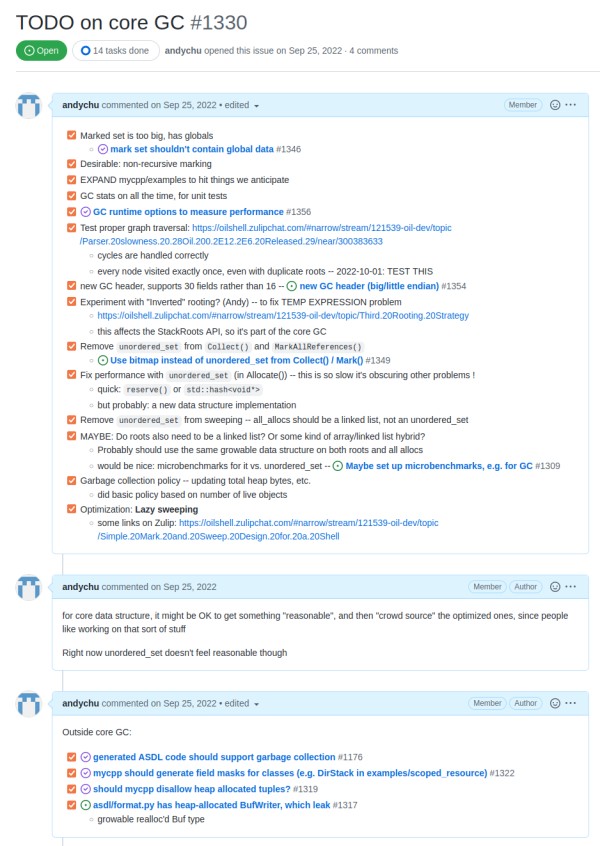
More answers for the curious:
For example, why not write it in Go? Go's runtime implements goroutines with OS threads, while shells use fork()-based concurrency. Go also doesn't use libc, which shells rely on extensively.
(That said, Go's collector is very readable, with many interesting comments!)
Here's another way of looking at our "manual collection point" design choice.
I believe the original problem was over-constrained, to the point that was impossible to solve:
var345 and var346 to debug! In contrast, our generated code is readable, and multiple contributors have debugged it with normal tools.When viewed this way, it's pretty clear to me that the last constraint is the one to relax.
Are there any other options? I don't think so, other than changing the C++ language itself, which seems to have stalled:
Manual collection points aren't fully general, but they solves exactly the problem we have. That is, we're able to precisely collect garbage in a subset of portable C++ code. It's easy to read, write, and generate code in this style.
If you got this far and were disappointed by the pictures, I like these animations: